Spätestens dann, wenn für verschiedene Personen Termine geplant werden müssen, und das auch unterwegs (im Kindergarten, beim Training etc.) kommt ein Papier-Familienkalender an seine Grenzen.
Gleichzeitig geht bei einem rein Online-Kalender die Übersichtlichkeit und der schnelle Blick zuhause auf den Kalender verloren.
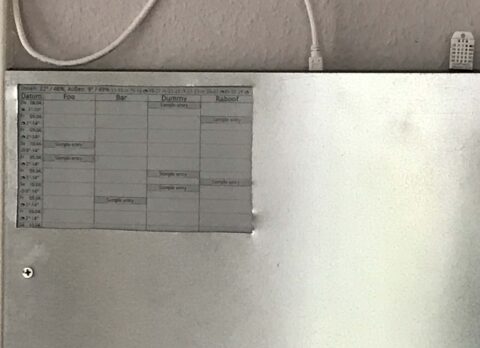
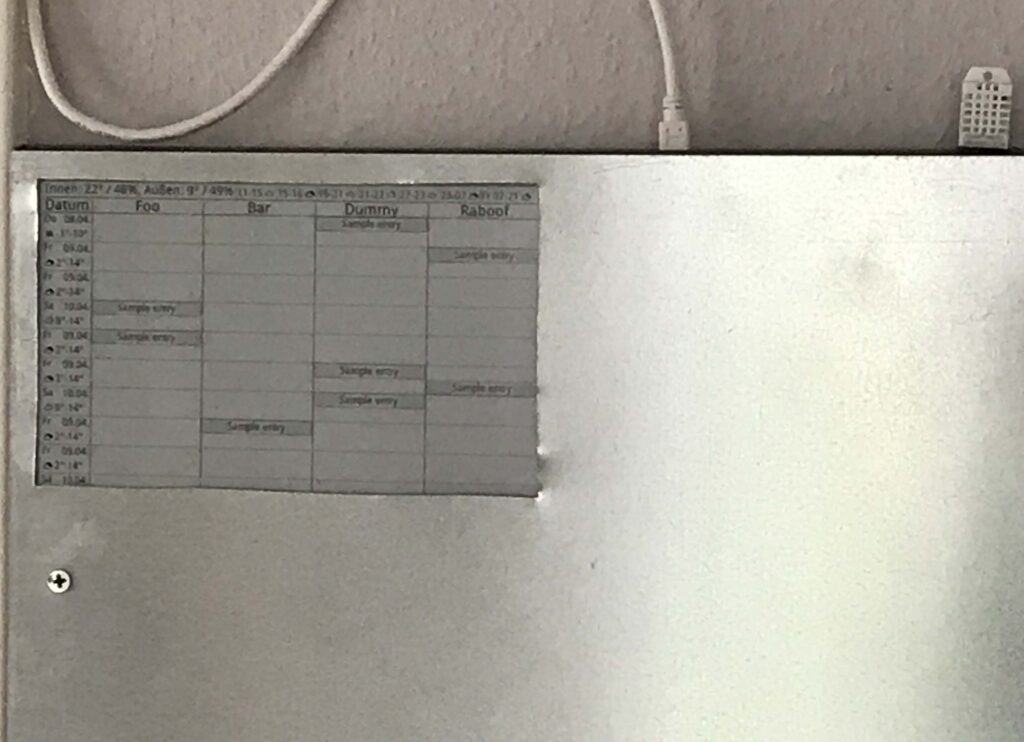
Die Lösung ist eine Anzeige für die Online-Kalender, die groß und dauerhaft gut ablesbar ist.
Ich stelle hier eine Variante mit einem e-Paper vor, das einerseits extrem wenig Strom verbraucht, gleichzeitig von den Materialkosten überschaubar ist (alles zusammen unter 150 EUR). Ich habe das Display (das sehr flach ist, ca. 0,5 cm Höhe) mit einem Stahl-Blech abgedeckt, das so auch als Magnetwand funktioniert.
Ich nutze das Display gleichzeitig für die Anzeige der Raumtemperatur (per DHT-22 Sensor gemessen) und der Wettervorhersage.
Ergebnis
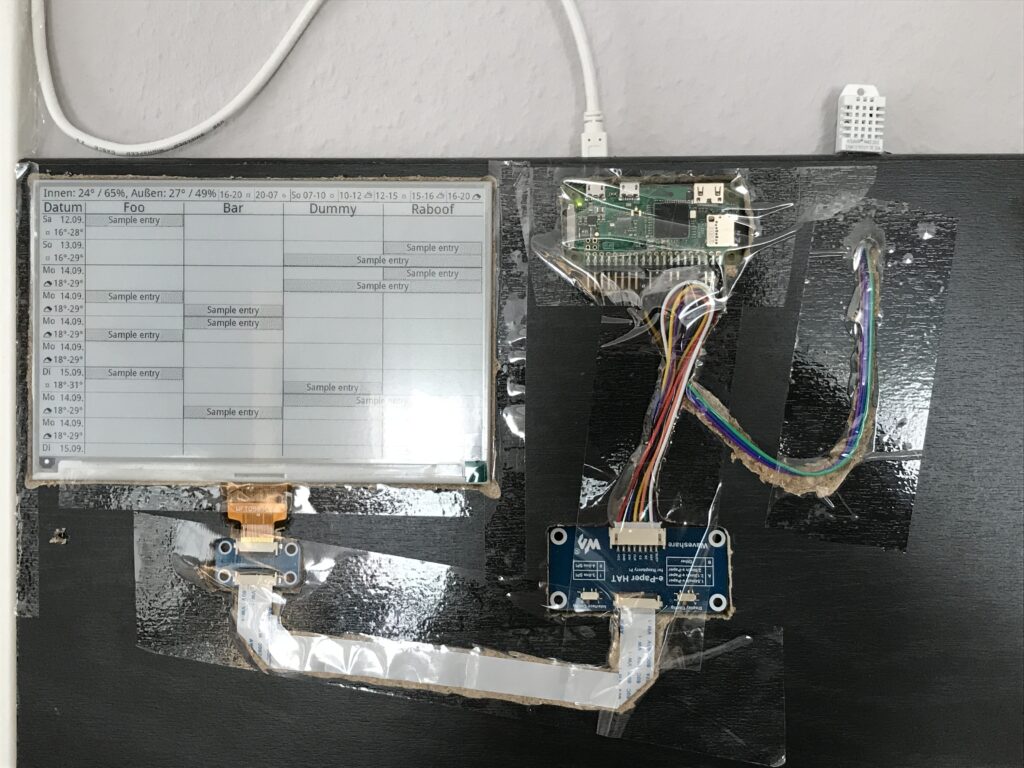
So sieht es unter dem Blech aus. Generell kann der Display-Adapter auch direkt auf den Raspberry aufgesteckt werden; ich habe mich aber als Platzgründen dazu entschieden, eine Winkel-Pfostenleiste in den Raspberry einzulöten und so etwas Bauhöhe einzusparen.
Hardware
Software
- CalDAV-Server, z.B. Nextcloud
- ggf. Wettervorhersage, z.B. OpenWeather (gibt einen kostenlosen Account)
- ein Python-Skript zum Rendern der Anzeige (siehe unten)
Python-Skript
Das Skript hier dient nur als Beispiel und muss an den konkreten Zweck angepasst werden, insbesondere was die Einbindung und Darstellung der Kalender angeht.
Zunächst folgende Bibliothek installieren: https://github.com/waveshare/e-Paper/, siehe https://github.com/waveshare/e-Paper/blob/master/RaspberryPi_JetsonNano/python/readme_rpi_EN.txt.
Der Import-Block orientiert sich an den Beispielen von waveshare:
#!/usr/bin/python
# -*- coding:utf-8 -*-
import sys
import os
import random
picdir = os.path.join(os.path.dirname(os.path.realpath(__file__)), 'pic')
libdir = os.path.join(os.path.dirname(os.path.realpath(__file__)), 'lib')
if os.path.exists(libdir):
    sys.path.append(libdir)

import logging
from waveshare_epd import epd7in5_V2
import time
from PIL import Image,ImageDraw,ImageFont
import traceback

from datetime import timedelta
from datetime import date
from datetime import time
from datetime import datetime
import locale
import caldav
import vobject
from tzlocal import get_localzone
import re
import requests
import json
import Adafruit_DHT

locale.setlocale(locale.LC_ALL, '')
logging.basicConfig(level=logging.ERROR)
Wir definieren noch zwei Hilfsfunktionen für die Darstellung der Temperatur und Berechnung der Startzeit für die Kalender-Einträge:
def temp(temp):
    return (("%i" + u'\u00b0') % round(temp))

def start(item):
    if isinstance(item.vevent.dtstart.value, datetime):
        return item.vevent.dtstart.value.time()
    else:
        return time(0, 0, 0)
Anschließend beginnt die Programmlogik mit dem Abruf der Wettervorhersage (Geokoordinaten und API-Key eintragen) und der lokalen Temperatur (falls ein DHT-22 Sensor verwendet wird:
try:
    try:
        forecast = requests.get("https://api.openweathermap.org/data/2.5/onecall?lat=49.0&lon=8.0&appid=xzy&lang=de&units=metric")
        forecast_json = forecast.json()
    except requests.exceptions.RequestException:
        print(datetime.now(), " could not connect to omv")
        exit()

    humidity, temperature = Adafruit_DHT.read_retry(Adafruit_DHT.DHT22, 4)
    if humidity is None or temperature is None:
        print(datetime.now(), " Failed to get reading DHT22")
        exit()
Jetzt zeichnen wir den Kalender inkl. Wettervorhersage mit den Icons von https://openweathermap.org/weather-conditions:
    logging.info("calendar start")

    epd = epd7in5_V2.EPD()

    font24 = ImageFont.truetype(os.path.join(picdir, 'Font.ttc'), 24)
    font20 = ImageFont.truetype(os.path.join(picdir, 'Font.ttc'), 20)
    font16 = ImageFont.truetype(os.path.join(picdir, 'Font.ttc'), 16)

    Himage = Image.new('L', (epd.width, epd.height), 255)  # 255: clear the frame
    draw = ImageDraw.Draw(Himage)
    text = "Innen: " + temp(temperature) + " / " + (("%i") % round(humidity)) + "%, Au" + u'\u00df' + "en: " + temp(forecast_json["current"]["temp"]) + " / " + str(forecast_json["current"]["humidit
    draw.text((3, -4), text, font = font20, fill = 0)
    x = draw.textsize(text, font = font20)[0] + 6
    i = 0
    icon = ""
    startTime = 0
    currentDate = date.today()
    while x < 780 and i < 48:
        hourly = forecast_json["hourly"][i]
        if hourly["weather"][0]["icon"] != icon:
            if startTime != 0:
                iconPng = Image.open("pic/" + icon + ".png")
                iconPng = iconPng.resize((22, 22))
                newDate = startTime.date()
                if newDate != currentDate:
                    lc = 0
                    currentDate = newDate
                    text = startTime.strftime("%a %H") + "-" + datetime.fromtimestamp(hourly["dt"]).strftime("%H")
                else:
                    lc = 128
                    text = startTime.strftime("%H") + "-" + datetime.fromtimestamp(hourly["dt"]).strftime("%H")
                draw.line((x, 0, x, 20), fill = lc)
                x = x + 2
                draw.text((x, 1), text, font = font16, fill = 0)
                x = x + draw.textsize(text, font = font16)[0]
                draw.bitmap((x, 0), iconPng)
                x = x + 22
            startTime = datetime.fromtimestamp(hourly["dt"])
            icon = hourly["weather"][0]["icon"]
        i = i + 1

    draw.line((0, 21, 799, 21), fill = 0)
    draw.text(((80 - draw.textsize('Datum', font = font24)[0])/2, 19), 'Datum', font = font24, fill = 0)
    draw.line((80, 25, 80, 479), fill = 0)
    draw.text((80 + (180 - draw.textsize('Foo', font = font24)[0])/2, 19), 'Foo', font = font24, fill = 0)
    draw.line((260, 25, 260, 479), fill = 0)
    draw.text((260 + (180 - draw.textsize('Bar', font = font24)[0])/2, 19), 'Bar', font = font24, fill = 0)
    draw.line((440, 25, 440, 479), fill = 0)
    draw.text((440 + (180 - draw.textsize('Dummy', font = font24)[0])/2, 19), 'Dummy', font = font24, fill = 0)
    draw.line((620, 25, 620, 479), fill = 0)
    draw.text((620 + (180 - draw.textsize('Raboof', font = font24)[0])/2, 19), 'Raboof', font = font24, fill = 0)
    draw.line((0, 45, 799, 45), fill = 0)
Jetzt lesen wir den Kalender aus und stellen ihn dar. Dabei ist die Idee, dass in einem gemeinsamen Kalender die Einträge mit dem Personen-Namen gepräfixt werden:
    client = caldav.DAVClient(url="https://example.com/remote.php/dav", username="foo", password="bar")
    my_principal = client.principal()
    calendars = my_principal.calendars()

    y = 46;
    i = 0;
    while y < 480:
        currentDate = date.today() + timedelta(days=i)
        draw.text((2, y), currentDate.strftime("%a"), font = font16, fill = 0)
        dateStr = currentDate.strftime("%d.%m.")
        draw.text((78 - draw.textsize(dateStr, font = font16)[0], y+1), dateStr, font = font16, fill = 0)
        oy = y
        lines = 0
        events = []
        for calendar in calendars:
            events_fetched = calendar.date_search(start=currentDate, end=(currentDate + timedelta(days=1)), expand=True)

            for event in events_fetched:
                try:
                    parsedCal = vobject.readOne(event.data)
                    events.append(parsedCal)
                except AttributeError as error:
                    # Output expected AttributeErrors.
                    print(error)
                except TypeError as error:
                    # Output expected TypeErrors.
                    print(error)

        events.sort(key=start)

        allDay = ""
        for parsedCal in events:
            summary = parsedCal.vevent.summary.value
            if summary.startswith("Foo:"):
                x = 80
                w = 179
                summary = summary[len("Foo:")+1:]
            elif summary.startswith("Bar:"):
                x = 260
                w = 179
                summary = summary[len("Bar:")+1:]
            elif summary.startswith("Dummy:"):
                x = 440
                w = 179
                summary = summary[len("Dummy:")+1:]
            elif summary.startswith("Raboof:"):
                x = 620
                w = 179
                summary = summary[len("Raboof:")+1:]
            if isinstance(parsedCal.vevent.dtstart.value, datetime):
                bc = 224
                allDay = ""
                if parsedCal.vevent.dtstart.value.date() == currentDate:
                    text = parsedCal.vevent.dtstart.value.astimezone(get_localzone()).strftime("%H:%M") + ": " + summary.strip()
                else:
                    text = u'\u2190' + " " + summary.strip()
                    bc = 200
            else:
                text = summary.strip()
                if allDay != "":
                    text = allDay + " / " + text
                    y = y - 23
                    lines = lines - 1

                allDay = text
                bc = 180
            if getattr(parsedCal.vevent, 'dtend', None) != None:
                if isinstance(parsedCal.vevent.dtend.value, datetime):
                    if parsedCal.vevent.dtend.value.date() > currentDate:
                        text = text + " " + u'\u2192'
                        bc = 200
                    elif (datetime.now(get_localzone()) - parsedCal.vevent.dtend.value) > timedelta(hours=2):
                        continue
            draw.rectangle((x+1, y, x+w-1, y+21), outline = 128, fill = bc)
            textWidth = draw.textsize(text, font = font16)[0]
            if textWidth > w:
                while textWidth >= w:
                    text = text[:len(text)-1]
                    textWidth = draw.textsize(text + "...", font = font16)[0]
                text = text + "..."
            draw.rectangle((x + 1 + (w - textWidth) / 2, y+1, x + 1 + (w - textWidth) / 2 + textWidth , y+20), outline = None, fill = 255)
            draw.text((x + 1 + (w - textWidth) / 2, y+1), text, font = font16, fill = 0)
            y = y + 23
            lines = lines + 1
        dailyForecast = None
        for daily in forecast_json["daily"]:
            if datetime.fromtimestamp(daily["dt"]).date() == currentDate:
                dailyForecast = daily
                break
        if dailyForecast != None:
            iconPng = Image.open("pic/" + dailyForecast["weather"][0]["icon"] + ".png")
            iconPng = iconPng.resize((22, 22))
            draw.bitmap((0, oy+23), iconPng)
            draw.text((22, oy+24), temp(dailyForecast["temp"]["min"]) + "-" + temp(dailyForecast["temp"]["max"]), font = font16, fill = 0)
            if lines == 0:
                lines = 2
                y = y + 46
            elif lines == 1:
                lines = 2
                y = y + 23
        if lines == 0:
            y = y + 23;
        if currentDate.weekday() == 6:
            draw.line((0, y-1, 799, y-1), fill = 0)
        else:
            draw.line((0, y-1, 799, y-1), fill = 140)
        i = i + 1
Anschließend wird das Bild in Schwarz/Weiß umgewandelt und Graustufen mit Dithering dargestellt:
result = Himage.convert("1")Sinnvollerweise kann man noch überprüfen, ob sich das Bild geändert hat, um unnötige Neudarstellungen (und damit verbundenes Flackern) zu vermeiden:
    try:
        last = Image.open("/mnt/ramdisk/calendar.png")
        if last.tobytes() == result.tobytes():
            exit()
    except IOError:
        logging.debug("file not found")

    result.save("/mnt/ramdisk/calendar.png")
Anschließend wird das Bild dargestellt:
logging.info("init and Clear")
epd.init()
epd.display(epd.getbuffer(result))
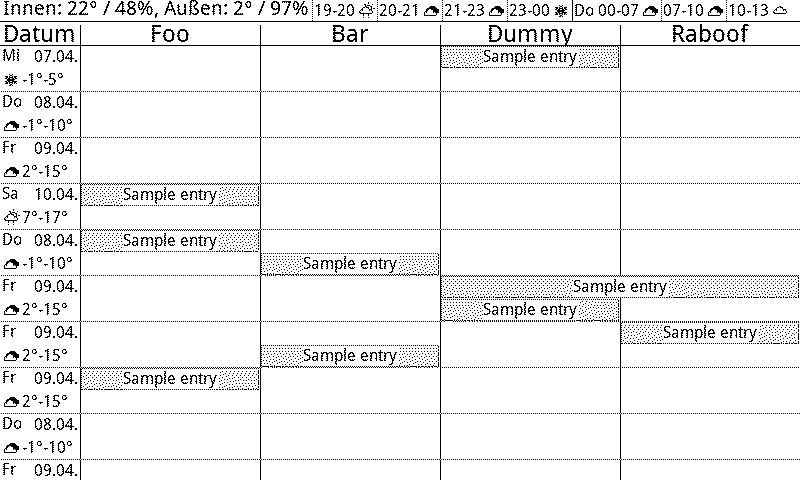
epd.sleep()So sieht der Kalender dann aus:
Schreibe einen Kommentar
Du musst angemeldet sein, um einen Kommentar abzugeben.